提示:文章写完后,目录可以自动生成,如何生成可参考右边的帮助文档
文章目录
- 前言
- 一、HighCharts是什么?
- 二、使用步骤
- 1.引入库
- 2.前端代码
- 3.展现结果
- 4.后台自动截图
- 总结
前言
提示:这里可以添加本文要记录的大概内容:
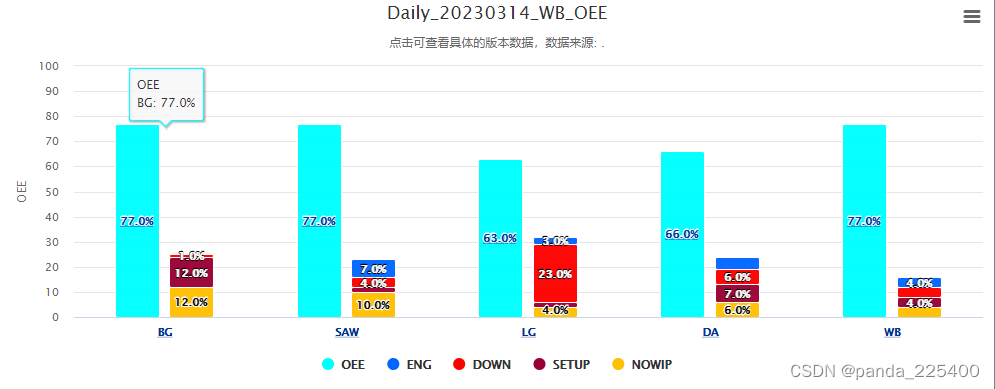
前段时间公司要统计各个站的OEE机台的使用率,在网页上前端上展现OEE图表,难点在与如何将这些数据转成合理的数据展现出来
提示:以下是本篇文章正文内容,下面案例可供参考
一、HighCharts是什么?
1、HighCharts是网页报表工具,开发语言是Javascript
2、HighCharts是一个简单易用、美观、跨平台、跨浏览器的,兼容 IE6+、完美支持移动端、图表类型丰富、方便快捷的 HTML5 交互性图表库
3、HighCharts支持图表的类型有:曲线图、柱状图、饼状图、区域图、散点图、综合图的各种图表需求。
二、使用步骤
1.引入库
代码如下(示例):
1、引入Jquery(HighCharts是基于Jquery框架开发的)
2、引入HighCharts.js
3、引入exporting.js(导出功能)
2.前端代码
代码如下(示例):
    <script type="text/javascript">
        var operData = [];
        $(document).ready(function () {

            var options = {
                chart: {
                    type: 'column',
                    events: {
                        drilldown: function (e) {
                            //alert("dddd");
                        }
                    }
                },
                colors: ['#00FFFF', '#0066FF', '#FF0000', '#990033', '#FFC000', '#FF0000', '#8d4653', '#8085e9', '#f15c80', '#e4d354', '#8085e8'],
                title: {
                    text: '各工序的OEE'

                },
                subtitle: {
                    text: '点击可查看具体的版本数据,数据来源: <a href="#"></a>.'

                },
                xAxis: {
                    type: 'category'
                },
                yAxis: {
                    title: {
                        text: 'OEE'
                    },
                    tickPositions: [0, 10, 20, 30, 40, 50, 60, 70, 80, 90, 100]
                },
                legend: {
                    enabled: true
                },
                plotOptions: {
                    series: {
                        borderWidth: 1,
                        borderColor: "#FFFFFF",
                        borderRadius: 2,
                        dataLabels: {
                            enabled: true,
                            format: '{point.y:.1f}%'
                        }
                    },
                    column: {
                        stacking: 'normal',
                        cursor: 'pointer',
                        point: {
                            events: {
                                click: function (e) {
                                    if (e.point.name != null) {
                                        //alert(e.point.name);
                                        var type = $("#<%=ddlType.ClientID %>").val();
                                        var year = $("#<%=ddlYear.ClientID %>").val();
                                        var monthWeekly = $("#<%=ddlMonthWeekly.ClientID %>").val();
                                        var day = $("#<%=ddlDay.ClientID %>").val();
                                        var depart = $("#<%=ddlOcapDepart.ClientID %>").val();

                                        var ndate = "";
                                        if (type == "Daily") {
                                            ndate = year + monthWeekly + day;
                                        } else if (type == "Weekly") {
                                            ndate = year + monthWeekly
                                        } else if (type == "Monthly") {
                                            ndate = year + monthWeekly
                                        }
                                        var title = type + "_" + ndate + "_" + depart + "_EquipList";

                                        $("#<%=HiddenField1.ClientID %>").val(e.point.name);
                                        $("#equipid").val("");
                                        $("#searchInfo").show();
                                        InitGird(title, type, ndate, depart, e.point.name);
                                    }
                                }
                            }
                        }
                    }
                },
                tooltip: {
                    useHTML: true,
                    style: {
                        padding: 0,
                        pointerEvents: 'auto'
                    },
                    shared: false,
                    formatter: function () {
                        var type = $("#<%=ddlType.ClientID %>").val();
                        var year = $("#<%=ddlYear.ClientID %>").val();
                        var monthWeekly = $("#<%=ddlMonthWeekly.ClientID %>").val();
                        var day = $("#<%=ddlDay.ClientID %>").val();
                        var depart = $("#<%=ddlOcapDepart.ClientID %>").val();
                        if (type == "Daily") {
                            ndate = year + monthWeekly + day;
                        } else if (type == "Weekly") {
                            ndate = year + monthWeekly
                        } else if (type == "Monthly") {
                            ndate = year + monthWeekly
                        }
                        if (type == "Daily") {
                            return this.series.name + "<br/>" + this.point.name + ': ' + this.point.y.toFixed(1) + '%';
                        } else {
                            return this.series.name + "<br/>" + '<a href="http://localhost:48057/Summary_OEE_Report_Oper_Detail.aspx?type=' + type + '&oper=' + this.point.name + '&ndate=' + ndate + '&depart=' + depart + '" target="_blank">' + this.point.name + ': ' + this.point.y.toFixed(1) + '%' + '</a>'
                        }
                    }
                },
                series: [],
                drilldown: {
                    series: []
                }
            };
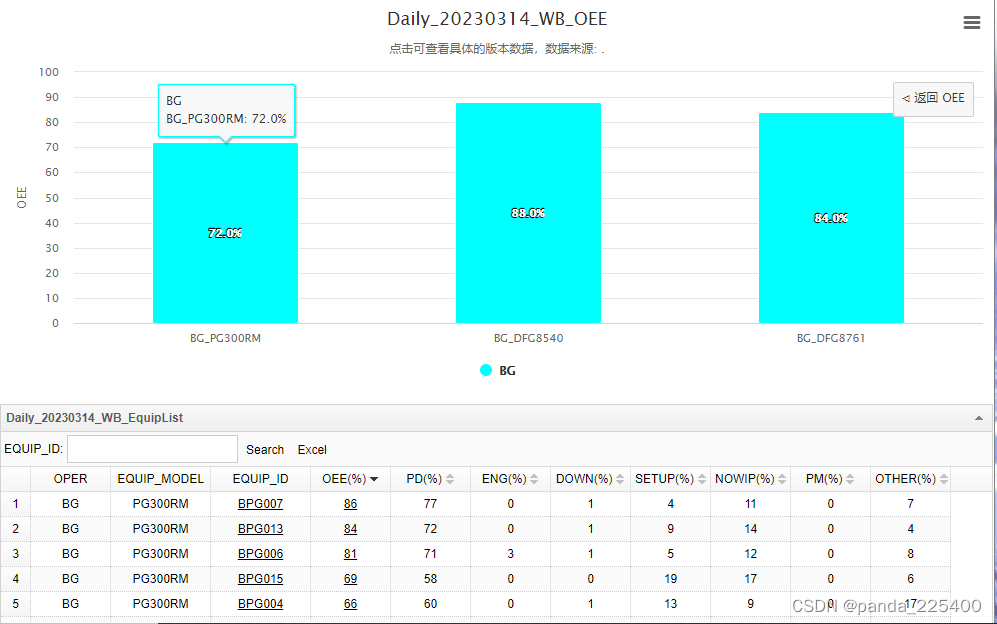
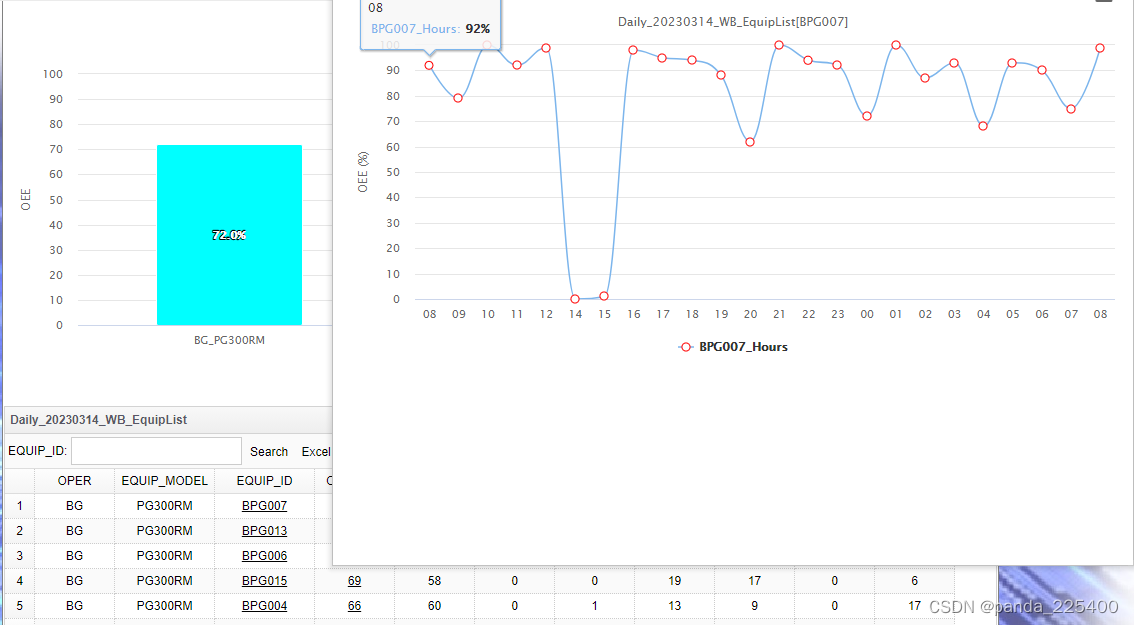
3.展现结果
4.后台自动截图
1、在服务器上部署自动截图的API
http://*********:11942/
2、创建模板
{
	"chart": {
		"width": 900,
		"type": "column"
	},
	"credits":false,
	"colors": [
		"#00FFFF",
		"#0066FF",
		"#FF0000",
		"#990033",
		"#FFC000",
		"#FF0000",
		"#8d4653",
		"#8085e9",
		"#f15c80",
		"#e4d354",
		"#8085e8"
	],
	"title": {
		"text": "$title"
	},
	"subtitle": {
		"text": ""
	},
	"xAxis": {
	    "type": "category",
		"labels": {
                "style": {
                    "fontWeight": "bold"
                }
            }
    },
	"yAxis": {
		"title": {
			"text": "OEE(%)"
		},

		"tickPositions": [0, 10, 20, 30, 40, 50, 60, 70, 80, 90, 100]
	},
	"legend": {
		"enabled": true
	},
	"plotOptions": {
		"series": {
			"borderWidth":1,
			"borderColor": "white",
			"borderRadius":2,
			"dataLabels": {
				"enabled": true,
				"format":"{point.y:.1f}%"
			}
		},
		"column": {
	        "stacking": "normal",
	        "cursor": "pointer",
	        "dataLabels": {
		        "enabled": true,
		        "color": "white",
		        "style": {
			        "textShadow": "0 0 3px black",
					"fontWeight": "bold"
		        }
	        }
        }
	},
	"tooltip": {
        "useHTML": true,
        "style": {
            "padding": 0,
            "pointerEvents": "auto"
        },
	    "shared": false
	 },
	"series": [$series],
    "drilldown": {
	    "series": [$drilldown]
    }
}
3、调用API接口生成图片
  string chartJsonPath = Environment.CurrentDirectory + "//Json//chart.json";
            StreamReader sr = new StreamReader(chartJsonPath, Encoding.Default);
            string line;
            string jsonobj = "";
            while ((line = sr.ReadLine()) != null)
            {
                jsonobj = jsonobj + line.ToString();
            }

            string url = System.Configuration.ConfigurationSettings.AppSettings["PhantomjsUrl"].ToString();
            string param = jsonobj.Replace("$series", sbSerie.ToString()).Replace("$drilldown", sbDrilldownSerie.ToString()).Replace("$title", type + "_" + ndate + "_" + depart + "_OEE");

            KTD.Utilities.BaseUtils.FileUtils.CreateFile(Encoding.UTF8.GetBytes(param), Environment.CurrentDirectory + "//Json//" + DateTime.Now.ToString("yyyyMMddHHmmss") + ".json");
            byte[] bytes;
            var client = new HttpClient();
            HttpContent content = HttpContent.Create(Encoding.UTF8.GetBytes(param), "application/json");
            using (HttpResponseMessage responseMessage = client.Post(url, content))
            {
                responseMessage.EnsureStatusIsSuccessful();
                bytes = responseMessage.Content.ReadAsByteArray();
            }

            MemoryStream stream = new MemoryStream(bytes);
            Bitmap bmp = new Bitmap(stream);
            string randomName = ndate +"_"+ depart+".png";
            string saveUrl = System.Configuration.ConfigurationSettings.AppSettings["SaveUrl"].ToString() + "//" + randomName;
            bmp.Save(saveUrl, ImageFormat.Png);
            stream.Dispose();
            stream.Close();
            bmp.Dispose();
3、截图效果如下
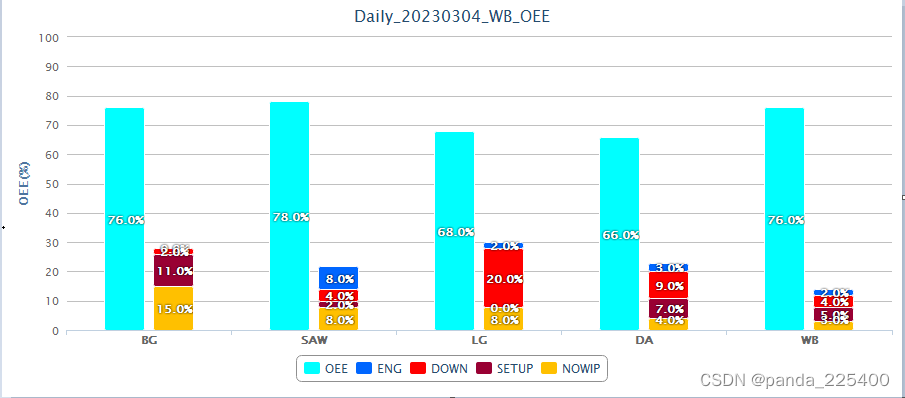
总结
发现截来的图片和系统执行出来的图样式不能完全一模一样,估计是使用脚本的版本不一样导致。